- Chart Art
- Posts
- Stocktwits Chart Art: April 18, 2024
Stocktwits Chart Art: April 18, 2024
The best charts and trade ideas from the day.
STOCKTWITS CHART ART: APRIL 18, 2024
The Stocktwits Summary 📝
It was another mixed day for the market, with cautious outlooks from Taiwan Semiconductor and Netflix weighing on the tech sector. Despite that, investors and traders continue to focus on individual stocks for opportunities. 🚧
Here’s how the major indexes ended the day:
Index | ST Sentiment Score | ST Message Volume |
|---|---|---|
$SPY (-0.21%) | Extremely Bullish (78) | High (56) |
$QQQ (-0.57%) | Extremely Bullish (78) | Neutral (54) |
$IWM (-0.08%) | Neutral (49) | High (57) |
$DIA (+0.10%) | Bearish (28) | High (56) |
*The ST Sentiment Score & Message Volume scales range from 0 to 100 (extremely bearish to extremely bullish). More info here.
And here were Stocktwits’ top Trending symbols:
CHART OF THE DAY
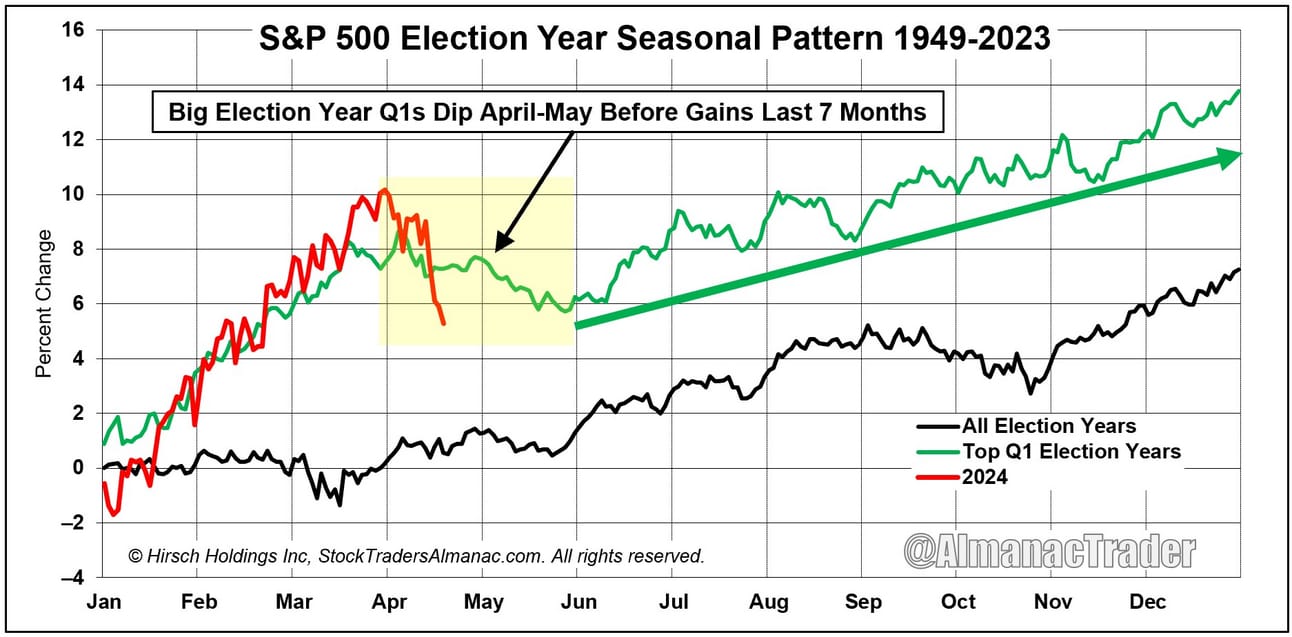
‘Tis The Season For Market Volatility 🗓️
Many market participants do not pay regular attention to seasonality. But every now and again, when the market environment starts to track a historical precedent, it pops back up on the mainstream radar. 👀
It’s currently one of those moments, and today’s “Chart of The Day” highlights why that is the case. The chart explains it well on its own, but the point is that election years typically experience a dip during April/May before stocks resume their upward trajectory through the end of the year.
If history continues to repeat, that means the next 5-6 weeks could be just as sucky as the past few have been. But the longer-term context would suggest using this weakness to buy stocks on the dip and prepare for a year-end rally. 🛒
Get In Touch 📬
Follow our social channels for great, real-time content on Stocktwits and Twitter. And check out our YouTube channel for in-depth video content! 📲
Email me (Tom Bruni) your feedback; I’d love to hear from you. 📧
Want to sponsor this newsletter and reach thousands of chart enthusiasts? Reach us here. 👍
Disclaimer: Content, news, research, tools, and securities symbols are for educational and illustrative purposes only and do not imply a recommendation or solicitation to buy or sell a particular security or to engage in any particular investment strategy. Read the full terms & conditions here. 🔍


