- Chart Art
- Posts
- Stocktwits Chart Art: August 08, 2024
Stocktwits Chart Art: August 08, 2024
The best charts and trade ideas from the day.
STOCKTWITS CHART ART: AUGUST 08, 2024
The Stocktwits Summary 📝
U.S. stocks are clawing their way back towards green for the week, but retail investors remain skeptical. Stocktwits user sentiment is in ‘bearish’ territory for all the major indexes, though many investors and traders are still finding opportunities in the market. Let’s dive into them. 👇
Here’s how the major indexes ended the day:
Index | ST Sentiment Score | ST Message Volume |
|---|---|---|
$SPY (+2.31%) | Bearish (29) | High (61) |
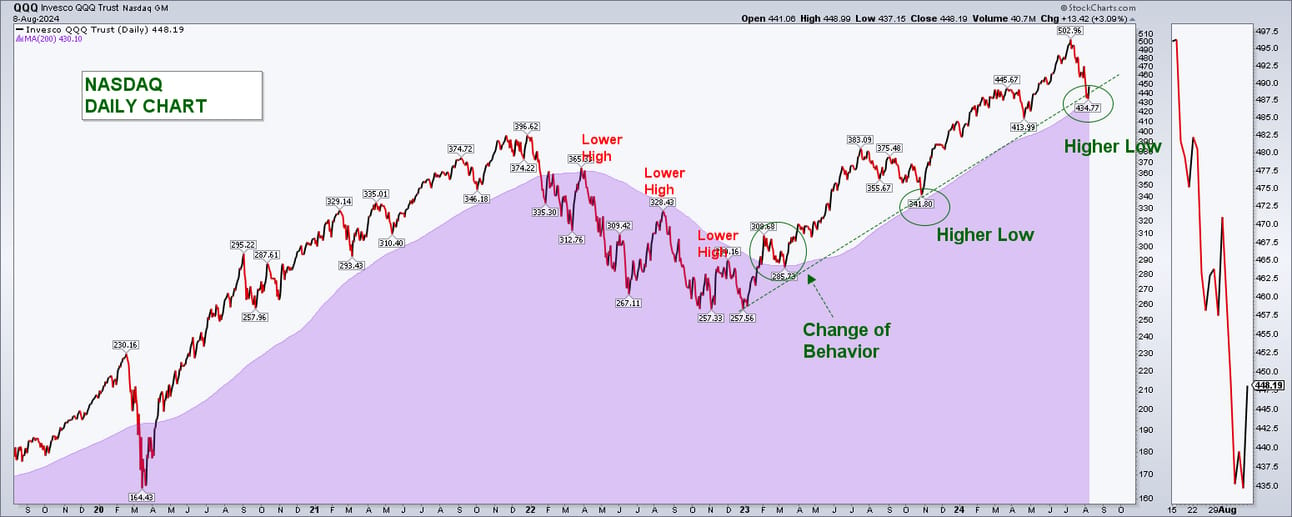
$QQQ (+3.06%) | Bearish (41) | High (60) |
$IWM (+1.74%) | Bearish (40) | Normal (53) |
$DIA (+1.74%) | Bearish (40) | Normal (53) |
*The ST Sentiment Score & Message Volume scales range from 0 to 100 (extremely bearish to extremely bullish). More info here.
And here were Stocktwits’ top Trending symbols:
CHART OF THE DAY
A Simple Way To Measure The Market’s Health ⚖️
There are various ways to measure whether stocks are in a bull or bear market, but one of the easiest is to use a basic trend indicator like a moving average. 🔍
Stocktwits user @lcc007 demonstrated this in practice, overlaying prices with the most commonly used long-term moving average, the 200-day. His chart shows that volatility typically picks up, and “bad things happen” when stocks are below that indicator.
And with prices battling that level currently, all eyes are on whether the stock market can maintain its bullish trend or if the recent volatility is here to stay. 🤔


