- Chart Art
- Posts
- Stocktwits Chart Art: June 13, 2024
Stocktwits Chart Art: June 13, 2024
The best charts and trade ideas from the day.
STOCKTWITS CHART ART: JUNE 13, 2024
The Stocktwits Summary 📝
The S&P 500 climbed to new all-time highs for the fortieth time this year, a pace that puts it on track to have the most of any year ever. Tech stocks remain in focus as traders look to Amazon, Netflix, and other laggards to play catchup. 🧑💻
Here’s how the major indexes ended the day:
Index | ST Sentiment Score | ST Message Volume |
|---|---|---|
$SPY (+0.20%) | Extremely Bearish (20) | High (58) |
$QQQ (+0.54%) | Bearish (25) | High (65) |
$IWM (-0.87%) | Bearish (41) | High (74) |
$DIA (-0.21%) | Bullish (71) | High (60) |
*The ST Sentiment Score & Message Volume scales range from 0 to 100 (extremely bearish to extremely bullish). More info here.
And here were Stocktwits’ top Trending symbols:
CHART OF THE DAY
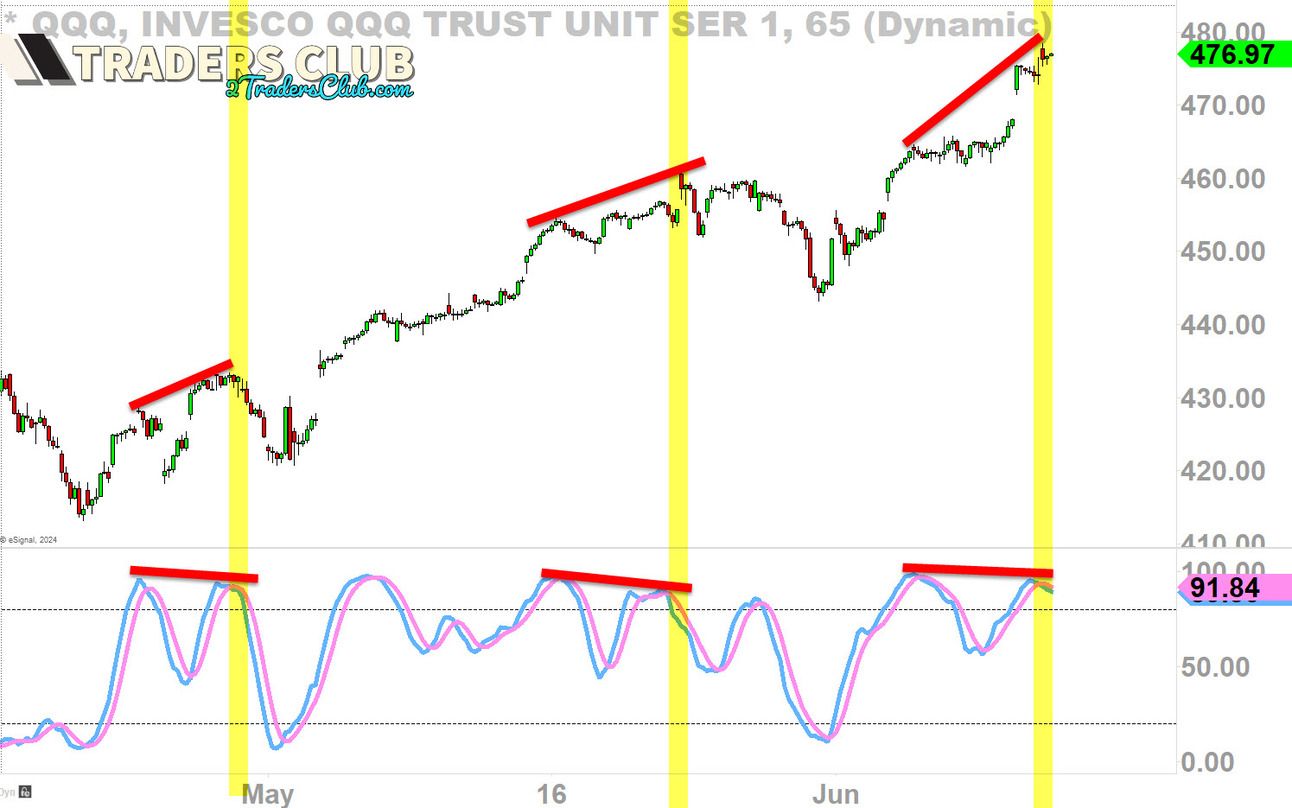
Nasdaq 100’s New Highs See Noteworthy Divergence 🧐
They say pictures speak a thousand words, and apparently, Stocktwits user @2kaykim agrees, given the lack of commentary associated with his chart. 😆
He’s showing a 65-minute chart of the Nasdaq 100 ($QQQ) over the last two months, along with a momentum indicator in the bottom pane. As seen by his red and yellow annotations, momentum has failed to keep pace with prices…leading to what technical analysts call a divergence.
This is a potential warning sign that short-term prices could experience a reversal to allow the current buying/selling imbalance to reset as it did during the last two instances a divergence developed in this index. ⚠️


